Transportation KPIs | Logistics Data
 Our proprietary shipper intelligence tool, KanoPI, provides you with robust data analytics capabilities and access to critical transportation KPIs.
This powerful instrument was built in response to customer issues with flawed transportation data. Often relying on spreadsheets, data was siloed by department, plagued with missing or inaccurate information, and not easily manipulated or leveraged for proactive decision making – often going underutilized.
We built our shipper intelligence toolset to help Zipline’s customers eliminate time spent on manually wrangling performance statistics, and more seriously, from missing out on opportunities to improve their supply chains.
 Now, KanoPI users can securely log in from anywhere to automatically see shipment data in one location, free from errors, with pre-calculated transportation KPIs, and added tools for business intelligence and discovery.
Our data analytic tools are used by emerging and established brands nationwide to help their logistics teams, sales teams, and C-Suites stay ahead.
Benefits of our Shipper Intelligence Toolset | Logistics Insights
• Provides visibility into transportation spend and performance
• Produces unbiased reports and alerts
• Facilitates cross-departmental collaboration
• Provides easy access to accurate and complete data sets
• Runs queries and sorts data so users can identify new opportunities
• Visualizes data with graphs, maps, and comparison tools
• Facilitates in-depth network analysis
Want to learn more?
Reach out for a KanoPI demo today
Features of our Transportation KPI Dashboard
With the pace of change today, it is critical to keep ahead of your customers and competition. KanoPI puts the information you need at your fingertips, making continuous improvement possible.
Shippers can log in securely any time to see KPIs and run evaluations. And Zipline Logistics’ solution consultants and data team are always available to assist with running queries, interpreting findings, and putting discoveries into action.
Different than other data dashboards, our shipper intelligence toolset was built by and for logistics professionals. All functionalities were created with your needs in mind.
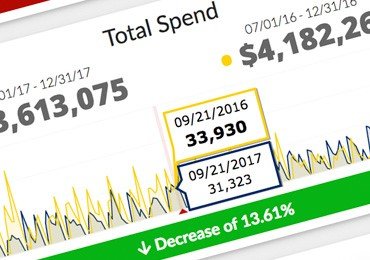
Quick-view KPIs – With more than 30 standard KPIs tiles available, you can see automated calculations for your transportation spend and performance.
This includes imperative metrics, such as:
-
-
- Total Loads
- Total Spend
- Total On-time Percentage
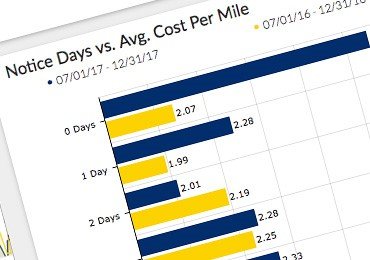
- Average Cost Per Mile
- Top Destinations by Spend
- Etc.
-
Data Drill Down – Behind each KPI tile you can see data drill-downs. Uncover what behaviors are disrupting your operations or causing you to overspend.
Data Filtering – Sort data by date, mode, shipper, or receiver.
Advanced Data Filtering – Go further into findings and sort data with and/or logic capabilities. Look at shipments that traveled over or under specific mileage parameters or price levels, with certain skid counts or weights. Easily identify outliers and exceptions where improvements can be made.
Comparison – We make it incredibly easy to compare data month to month, year to year, or over a custom date range.
Save Queries – Need to run the same query again and again? Save down your filters and access immediately at log in.
Download – Need to download a chart or report for use in a presentation? KANOPI users can easily mark up charts then download for personal use.
Imaging and Mapping – See highly visual maps and graphs related to your supply chain.
Customization – Our developers are here to make KanoPI work for you. We can customize the platform in a few different ways:
- If you need to provide multiple logins and custom levels of access to different departments or teams, we can quickly change privacy protocols to meet your demands.
- Want to see a metric not currently tracked? We can build that for you. Looking at your input sources, we can generate a custom algorithm that helps your business track what’s most important.
- Additionally, Zipline’s tech team can add, remove, or rearrange KPI tiles to meet your preferences. That means you get the data you want, where you want it, when you need it.
- Want to make KanoPI look more like your brand? No problem. We can edit colors and add your logo(s).
